线形图
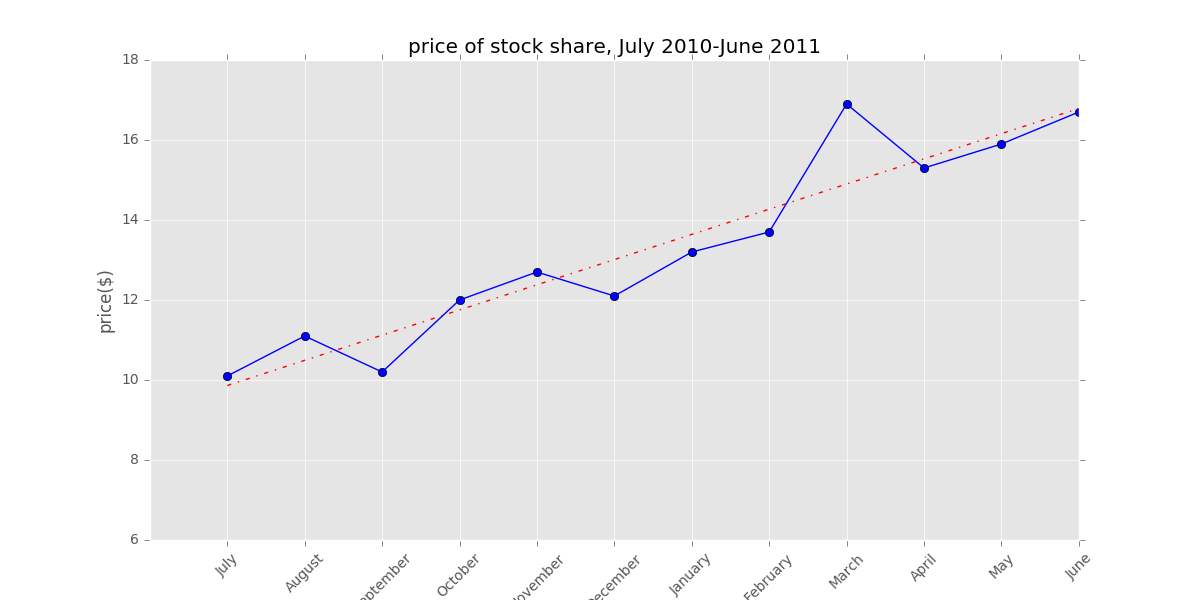
一家投资公司有如下12个月的特定股票业绩数据如下表
这一年间,股价是上涨?下跌?还是不变?
| July | August | September | October | November | December |
|---|---|---|---|---|---|
| 10.1 | 11.1 | 10.2 | 12 | 12.7 | 12.1 |
| January | February | March | April | May | June |
|---|---|---|---|---|---|
| 13.2 | 13.7 | 16.9 | 15.3 | 15.9 | 16.7 |
线性图可以用于随时间变化的事物

从图中很容易发现这每个月之间股价有涨有跌,对于问题,这一年整体趋势是涨的
利用pyhton绘制线性图
import numpy as np
import matplotlib.pyplot as plt
from scipy import optimize


def line_fun(x, theate, beta):
    return theate * x + beta


stock_name = ['July', 'August', 'September', 'October', 'November', 'December',
         'January', 'February', 'March', 'April', 'May', 'June']
stock_num = np.arange(1, len(stock_name)+1)
price = np.array([10.1, 11.1, 10.2, 12, 12.7, 12.1, 13.2, 13.7, 16.9, 15.3, 15.9, 16.7])
price_y = np.arange(6, 20, 2)

# 线性拟合
theate, beta = optimize.curve_fit(line_fun, stock_num, price)[0]
y = line_fun(stock_num, theate, beta)

plt.style.use('ggplot')
plt.figure(figsize=(14, 6))
plt.plot(stock_num, price, 'b-o')
plt.plot(stock_num, y, 'r-.')
plt.xticks(stock_num, stock_name, rotation=45)
plt.yticks(price_y)
plt.title('price of stock share, July 2010-June 2011')
plt.xlabel('months')
plt.ylabel("price($)")
plt.show()
博主个人能力有限,错误在所难免.
如发现错误请不要吝啬,发邮件给博主更正内容,在此提前鸣谢.
Email: JentChang@163.com (来信请注明文章标题,如果附带链接就更方便了)


